


When you are a small business owner or entrepreneur, it often feels like you need to be a jack of all trades for your company. Growing it from the ground up, keeping an eye on production and service, and at the same time figuring out sales.
A lot of us in that situation think, well, let’s just hire a sales team and solve the problem. Well, for most, this is not a realistic financial decision, not to mention that just training a good sales team takes time.
So who’s the best person for the job? Well, you are! And don’t worry, you got this!
You know your product the best, you know what you can offer, which timelines work, and how to best angle the sales to each business.
If you are not sure how well you are doing in comparison to other B2B owners and entrepreneurs who sell - we have a solution.
We teamed up with Databox to create a benchmark group exclusively for B2B business owners who sell. With this live, always-up-to-date benchmark study, you can anonymously see how you stack up with the sales metrics of other business owners who sell.
With data from 300+ companies and growing, this provides great insights into how you are performing across the board. You can easily discover in which metrics you are leading and in which you are underperforming and need to make changes.
Members of the group can even track their performance vs. the benchmark over time, making it easy to see progress or the lack thereof.
The best part?
- It's 100% anonymous and
- It is 100% free
This means that you can compare your data to similar companies without worrying about anyone sharing it.
Before we share some of the data we compiled here is how to read the benchmark charts.
How to Read the Benchmark Charts
In our Benchmark Group, you will see charts similar to the one below. Now if you are familiar with statistical analysis, these are very easy to read. On the other hand, if this is really new to you, it can be a bit confusing, but that is why you can go through this useful guide and learn how to read them in no time.
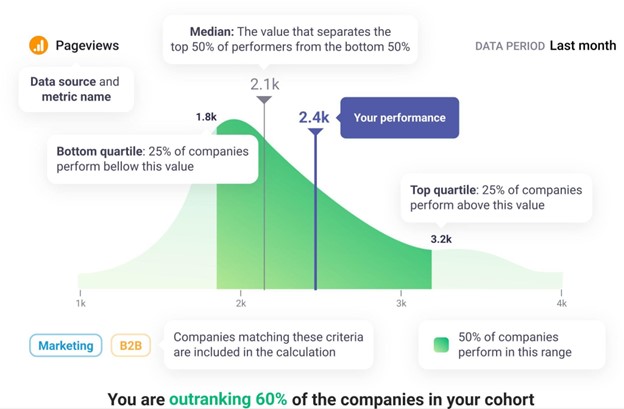
This chart shows a fictitious company’s performance against a sample of companies.
- The blue vertical line represents a company’s performance in the previous month. For this company, it shows 2,400 pageviews. The chart also shows the following:
- The bottom 25% of performers for this metric had below 1,800 pageviews.
- The top 25% of performers had above 3,200 pageviews.
- The median value is 2,100 sessions, which means that 50% of companies had more than 2,100 sessions in the previous month, and 50% had less.
- The height of the green chart shows the frequency at which someone had the value that’s shown on the horizontal or x-axis. For example, in this chart, a relatively large % of the population had pageviews of around 2,000 last month, as that’s where the peak of the chart is.
Now that you know how to read the graphs, we’ll share some of the actual data from our group below.
However, you can join the group for access to the rest, and to see up-to-date data and historical benchmarks too.
Sales Benchmarks for B2B Business Owners Who Sell
Within this group, we focus on data from three integrations to give us a well-rounded view of your sales success. These include HubSport CRM, Salesforce CRM, and HubSpot Marketing.
The group shares data on a total of 16 sales metrics. For this blog post, we will be looking at the following:
-
- Sessions - Number of times the Site was Visited during the specified Date Range - HubSpot Marketing
- Deals Created - Number of Deals Created during the specified Date Range - HubSpot CRM
- Total Contacts (marketing) -Total number of Contacts - HubSpot CRM
- Deals Closed Won Amount - total value of all deals that have been marked as "closed-won" - HubSpot CRM
Monitoring these metrics and comparing your data to the industry benchmarks can help shape your sales strategy and increase your efficiency.
So let’s dive in!
According to our benchmark group of over three hundred B2B owners, the median value of the Sessions metric for October 2023 was 1.66K. For the Deals Created, this value was 14, while the median value for Dealers Closed Won Amount was $35,250.00. Finally, the median value for Emails Logged was 259.
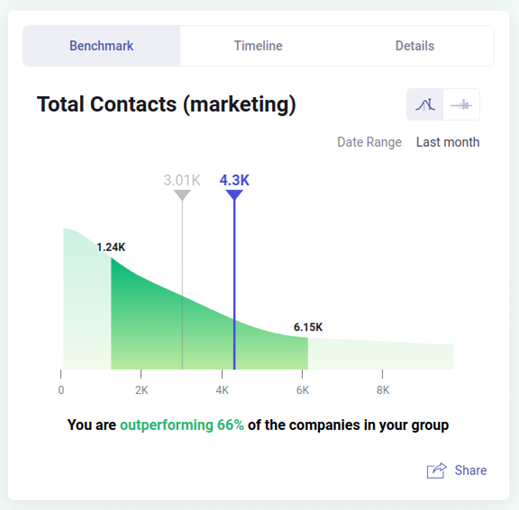
Here’s a chart showing the distribution of Total Contacts (marketing) values for one of the group members:
 We removed our member’s name since these benchmark comparisons are anonymous and private to each company.
The height of the green area shows the percentage of companies that have Total Contacts in that range. As you can see, the height of the chart on the left of the median as the number of Total Contacts approaches zero is very high. This means that lots of companies have very few Total Contacts. In fact, 25% of the sample had between zero and 1.24k, while 25% of the sample had between 1.25k and 3.01k.
On the right side of the chart, you can see that 25% of the companies had between 3.01k and 6.15k, the range is wider in this case. We can also see that 25% of the sample had somewhere north of 6.15k of Total Contacts. This member is performing better than 66% of the companies in the group!
If you have more than 3.01k total contacts, you’re doing better than half the group.
As mentioned above, when you join the group, you’ll see charts like this. If it is green, you’re doing better than at least 50% of the sample, which means that you have more than 3.01k total contacts.
Based on this, we can determine that this company is obviously doing great.
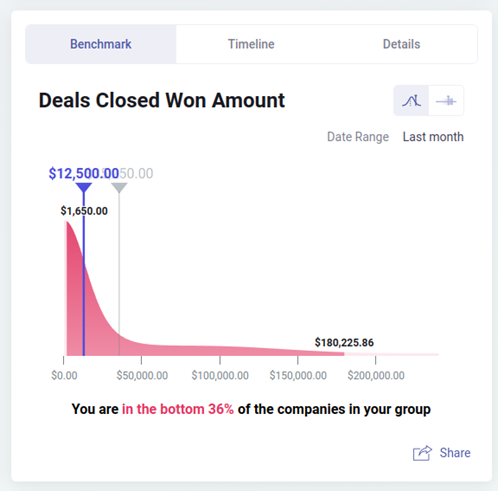
However, this is not the case for all of their metrics. For example, Let's look at another metric from the group - Deals Closed Won Amount. Sadly, for this specific metric, the company in question is in the bottom 36%.
This means that there is room for improvement for this company when it comes to the amount of Deals Closed Won.
 Please keep in mind that your stats will vary depending on your sales efforts. But don’t get discouraged - simply dive into the insights and make the changes necessary to hit your goals.
See how you measure by joining the group and connecting your HubSpot Marketing, HubSpot CRM, and Salesforce CRM.
Get More Industry Insights
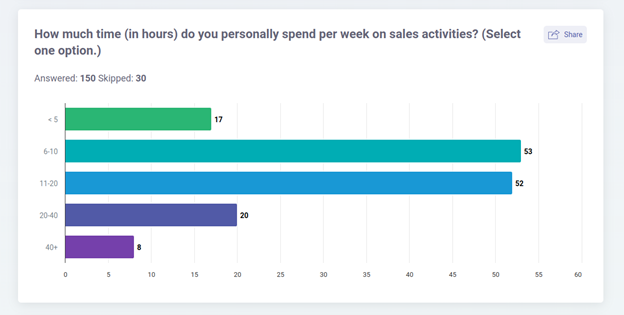
If you want to learn about how other small business owners and entrepreneurs navigate sales, take part in our The Sales Habits of Highly Successful Small Business Owners and Entrepreneurs survey. Here are some interesting insights from over 150 entrepreneurs who participated.
For example, most entrepreneurs spend 6-10 hours a week on sales activities, while only a small number of participants reported that number to be over 40.
How much time do you spend?
The survey is still open, and we invite you to take it. That way, you will be among the first to get your hands on all the interesting insights that it reveals.